Microsoft Excel is one of the key applications of the modern workplace. After all, no spreadsheet program can do it quite like Microsoft’s robust classic office program — one application in a suite of tools that have remained a constant in the office for decades.
But, with the onset of artificial intelligence, Microsoft has found new ways to innovate in even these classic programs. Microsoft Copilot utilises GPT-4 — one of the world’s most powerful AI language models — to help boost your workplace’s productivity. And, it can be used in Microsoft Excel to take your spreadsheeting to the stratosphere.
In this article, we will go over the top five ways you can utilise Copilot in Microsoft Excel to take advantage of the power of artificial intelligence and boost your productivity and workflow.
Top Copilot in Microsoft Excel Uses
Quickly Create PivotTables
PivotTables are vital to using Microsoft Excel effectively. They let you summarise data and find trends, which can be integral to helping your organisation monitor and find success. But, creating a PivotTable takes time and effort — and you’ll need to take time out of your day to do so.
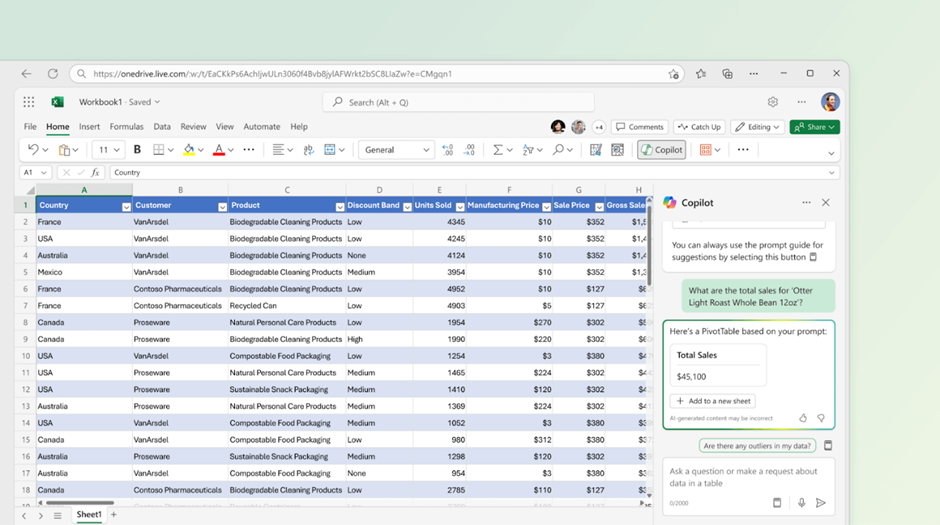
You can easily use Copilot for Microsoft Excel to make the process far more simple, letting you create a PivotTable in just a single prompt. All you have to do is tell Copilot that you want it to “Create a PivotTable based on [your chosen data])” and Copilot will easily do so.
But, far more easily, you can simply ask Copilot about a statistic from a dataset and it will contextually make a PivotTable. For example, you can simply just ask “What is the total value of my inventory?”, and Copilot will create a PivotTable to express the information that you’ve asked for.
This will save you lots of time and help you be more productive — as creating a PivotTable is a process that shouldn’t take time out of your day.
Create Data Visualisations
Data visualisation is key for understanding and processing data visually. After all, numbers and raw data are much harder for the brain to process than charts, graphs, and other data visualisation tools.
But, creating a nice-looking visual can take chunks of time from your day — ensuring that your chart has both clarity and conveys the information you want it to thoroughly and effectively can be a headache. However, Microsoft Copilot can do this with just a simple prompt.
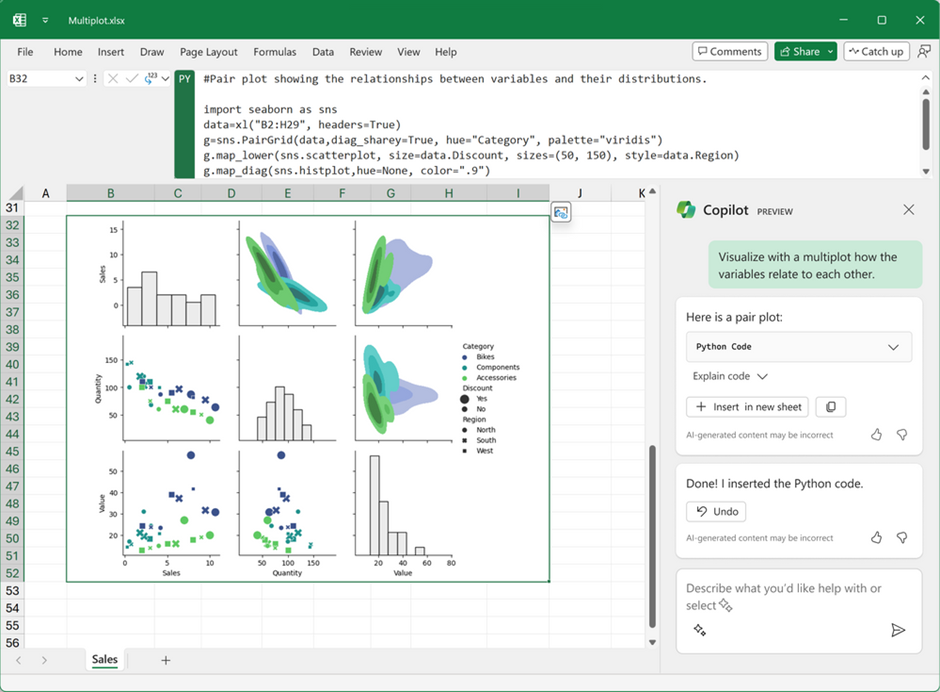
All you have to do is ask Copilot to visualise whatever you want it to visualise — for example, you could tell it to “Visualise this table of data” and it would do so. However, Copilot goes further than that — for example, it works with data sets such as Python Code, meaning you can visualise any data that you feed it within Excel.
Rather than having to fiddle around with parameters to ensure that your visualisation is perfect, Copilot does it all in a matter of seconds.
Discover Trends in Data
While we’re pretty good at finding trends in data, it’s pretty easy for the human brain to miss trends and patterns in data. After all, sometimes you’ll see certain trends while missing others — and some trends are too subtle to be found by the naked eye.
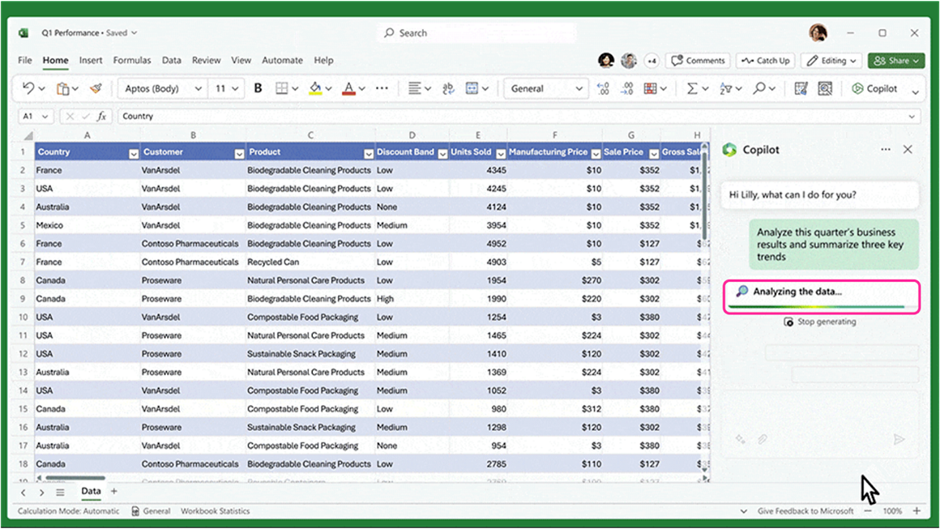
Microsoft Copilot can find all of these trends — ensuring that you’re not going to miss a thing. It can help you find new trends and patterns in a matter of seconds — by analysing the data thoroughly and picking out the most effective trends.
All you have to do is ask Copilot to “Analyse [your chosen data] and summarise five key trends” and Copilot will do so — giving you a full analysis of your data within seconds.
Highlight, Sort and Filter Data
If unsorted, Microsoft Excel spreadsheets can become messy and hard to navigate — meaning that finding key information can be a maze. While Excel’s filtering and sorting tools are pretty good, it still takes a while to find what you’re looking for — but, Copilot can do this in seconds.
Simply just ask Copilot to sort or filter your data in whatever way you’d like — such as “Sort this data by cost, lowest to highest” — or ask it to find a specific part of your data and highlight it to you. Much like with anything else in its toolset, Copilot will be able to do so in seconds — saving you time and making the whole process just far simpler.
Generate Formula Columns
Formula columns are vital for performing calculations, as they let you turn multiple columns into whole calculations to save you time and effort. But, creating them can still be a finicky process — after all, working out the right formulas you need to create a more complex formula column can be a pain.
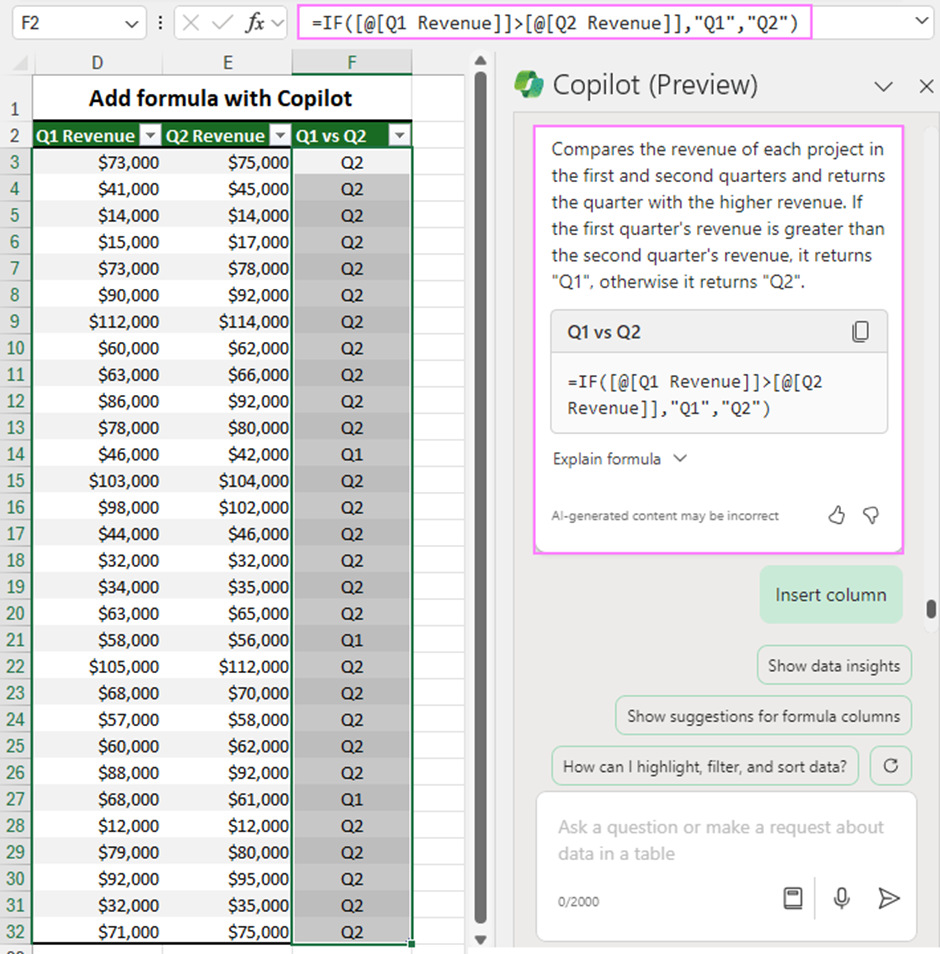
Microsoft Copilot can take care of this in seconds, generating a formula column to fulfil your needs with a simple prompt. All you need to do is ask Copilot to “make a formula column based on [the specified data]” and Copilot will do so — giving you a formula column to insert into your spreadsheet.
However, there is also an easier way to do this using Copilot. You can simply click the ‘show suggestions for formula columns’ button, and Copilot will give you suggestions for formula columns that you can use within this spreadsheet — tailored to make your workflow easier.
How to Get Started
Microsoft Copilot is a powerful tool that can truly empower your workflow. With it, you can turn tasks that would take time out of your day into the time that it takes to type a simple sentence — letting you dedicate your time to more important tasks.
If you’re looking to get started with Microsoft 365 and Copilot but don’t know where to begin, reach out to our experts today. We’ll be able to help you get started and help you find your footing in the world of Microsoft 365.
Get in touch with us now and see how we can help.
